Taxes April 14, 2014

An Exchange Means More to Reinvest

 An Exchange Means More to Reinvest

Section 1031 exchange for rental and investment real estate is a tool that allows investors to move the gain from one property to another without immediate income tax consequences. 

An instant benefit is to postpone the tax due which gives the investor a larger amount of proceeds to invest.  In the example shown, the investor has 21% more proceeds to invest and grow over time than if he had paid the taxes due instead of exchanging.

A legitimate long-term goal might be to make qualified exchanges from one property to another until the investor dies.  The heirs would then receive a stepped-up basis on the property based on the market value at the time of the decedent’s death and possibly avoiding taxes altogether.

There are specific requirements to be met in order for the exchange to qualify. For more information on exchanges, see IRS publication 544.  In addition to enlisting the services of a real estate professional familiar with investment property, seek the help of Qualified Intermediary to facilitate the intricacies of the exchange.  Your real estate agent can help you locate one.

Exchange example.png

Neighborhood April 11, 2014

Target Range

Market Trends April 7, 2014

Is The Window Closing?

iStock_000011016597Small 250.jpg

With interest rates lower than they’ve been in over 40 years, it may be difficult to think of a “window of opportunity” closing.  However, it isn’t difficult to understand that it may very probably cost more to live in a home in the near future due to rising interest rates and prices.

Zillow recently reported results from a nationwide study that home values are expected to appreciate by 4.5% through the end of the year.  Coupled with Freddie Mac’s projection that rates are going up, the cost of housing for buyers by the end of the year will be higher than it is now.

While uncertainty of the future can stagnate some people, the fear of loss can be much more devastating when a person realizes that the amount they pay to live and enjoy a home could have been considerably lower had they acted when prices and mortgage rates were lower.

The following example considers a $250,000 purchase today with a FHA mortgage compared to what it might be at the end of the year with a higher price and interest rate as discussed earlier.  The net effect is that it will cost $191.87 to live in the very same home based on the cost of waiting to buy.

To see what the cost might be for your price range, use this Cost of Waiting to Buy spreadsheet.

cost of waiting.png


Market Trends April 4, 2014

Interest Rates Are Not Getting Any Lower!

"One thing seems certain: we aren't likely to see average 30-year fixed mortgage rates return to the historic lows experienced in 2012."

– Freddie Mac,  March 24, 2014

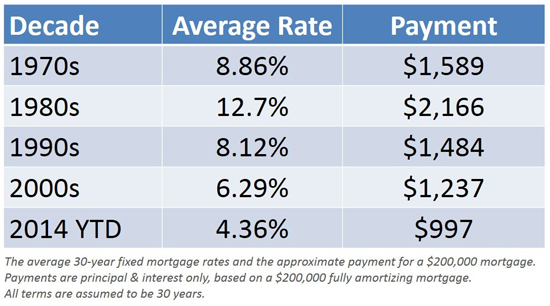
There are those that hope that 30-year mortgage interest rates will head back under 4%. Obviously, for any prospective home purchaser that would be great news. However, there is probably a greater chance that interest rates will return to the greater than 6% rate of the last decade before they would return to theless than 3.5% rate of 2012.

Freddie Mac, in one of four original posts on their new blog, explained that current rates are still extremely low compared to historic averages:

"The all-time record low – since Freddie Mac began tracking mortgage rates in 1971 – was 3.31% in November 2012. Conversely, the all-time record high occurred in October of 1981, hitting 18.63%. That's more than four times higher than today's average 30-year fixed rate of 4.32% as of March 20…rates hovering around 4.5% may be high relative to last year, but something to celebrate compared to almost any year since 1971."

Rates over decades

If you are thinking of buying a home, waiting for a dramatic decrease in mortgage rates might not make sense.


Taxes March 31, 2014

Looking For The Largest Deduction?


Standard Itemized.png

IRS allows taxpayers the option to take the standard deduction or the itemized deduction.  The astute taxpayer will compare to see which one will result in the greatest deduction and the election can be made each year.

The 2013 standard deduction for a married couple filing jointly is $12,200 and $6,100 for a single taxpayer.  It doesn’t require any proof of actual expense and has no requirement for home ownership.

Items that can be included on Schedule A for itemized deductions include: 

  • Certain taxes paid for state and local income tax, general sales tax, real estate property taxes, personal property taxes or other taxes paid
  • Qualified home mortgage interest, investment interest or possibly, mortgage insurance premiums
  • Charitable contributions
  • Casualty or theft losses
  • Medical and dental expenses that exceed 7.5% of adjusted gross income if born before 1/2/49 or 10% if born after 1/2/49
  • Job expenses and other miscellaneous deductions that exceed 2% of adjusted gross income

A non-homeowner taxpayer who has been taking the standard deduction needs to consider that it isn’t just the ability to deduct the mortgage interest and property taxes.

While the standard deduction might be the obvious choice for a non-homeowner, the combination of the mortgage interest and the property taxes plus other allowable deductions not recognized previously such as charitable contributions, now makes taking the itemized deductions significantly more advantageous. 

Uncategorized March 26, 2014

To Zillow, or not to Zillow

Written by Diane Beck

Zillow is a website that consumers can shop for real estate.  It is the fastest growing, and currently has the largest number of consumers in the country.  If you are a home buyer and shopping for a home they have an app for your smart device that will automatically update all surrounding homes for sale in the area when you drive into a neighborhood. That's very cool and consumers love that feature.  Trulia and Realtor.com currently have the same app, but buyers love Zillow.

Multiple Listing Services (MLS) across the country have created partnership agreements to share their data with these services, which is good for the consumer.  However, most recently many of the largest MLS's in the country have cancelled their agreements for many reasons.  First of all- the information is not always accurate; secondly the agents that pay Zillow or Trulia the most money are the "Featured Agents" or "Premier Agents" on listings that actually belong to another listing agent or company.  They have included fine print indicating the Listing Office or Agent, but you have to really look for it.

The "Zestimate" has become a household name with many.  Unfortunately in Montana that is not an accurate estimate of value of real estate.  Montana is a non-disclosure state which means that sales price information is NOT available to the public. Most other states do allow this information to be reached by consumers. Zillow's "Zestimates" are simply the current tax appraised value of the home, which is public record and most often times is NOT accurate.

The good news — if you are one of the 90% who want to search online for a home you have many choices to search.  Find the one that you like to use and stick with it.  All listings should be featured on every site. If for any reason they aren’t there I would suggest not using that site for your home search.

The bad news — if you are thinking of selling your home and want an estimate of current market value, the Zestimate is of no value to you.  You can get the same number by pulling up your tax information and finding the current appraised value, which as I said is simply the current tax appraised value.  To receive the best results in what your home would sell for in the current market will need to call a real estate professional to obtain your Current Market Analysis.  The Current Market Analysis is based on the most recent homes that have sold in your neighborhood along with the active listings that would be in competition with your home.

Here's a great example:

 Zillow- 2315 Briggs Street

This home's market value is right about $200,000 based on the most recent sales and active competitive listings.  The "Zestimate" on this home is $260,000.  It would appear that this house is a "screaming deal" and should be sold by now, but it's not.

The Zestimate puts a false sense of the home’s market value in the owner’s mind, which can create problems with those looking at the home.

It will be interesting how this "game" unfolds in the next few years.


Uncategorized March 21, 2014

Why You Need a Real Estate Agent

Market Trends March 10, 2014

Home Inventory Levels Are Up!

Market Trends February 28, 2014

Market Trends in Missoula

Market Trends

See below for the latest market statistics from the Missoula Organization of REALTORS®
Market information solely from listings entered into the MOR Regional Multiple Listing Service. Therefore, figures may not reflect all real estate activity in the market.

Residential Market Activity in the Missoula Urban Area
(residential, AND residential with acreage)

Missoula Urban Area – Month of January

Year # of Sales Median Price Avg Days on Market
2014 43 $210,000 107
2013 57 $185,000 131
2012 53 $187,500 138
2011 43 $214,000 142
2010 40 $214,450 120
2009 36 $236,077 141


Missoula Urban Area YTD Jan 1 to Jan 31, 2014

Year # of Sales Median Price Avg Days on Market
2014 43 $210,000 107
2013 57 $185,000 131
2012 53 $187,500 138
2011 43 $214,000 142
2010 40 $214,450 120
2009 36 $236,077 141

Sales represent properties that have transferred and the transaction has closed. It is the best reliable indicator of what prices the real estate market will bear.
Jan Blue Graph


Residential Market Activity in Missoula County
(residential, AND residential with acreage)

Missoula County – Month of January

Year # of Sales Median Price Avg Days on Market
2014 55 $210,000 139
2013 75 $196,500 135
2012 67 $192,500 143
2011 54 $204,250 139
2010 47 $213,900 119
2009 41 $235,000 160


Missoula County – YTD – Jan 1 to Jan 31, 2014

Year # of Sales Median Price Avg Days on Market
2014 55 $210,000 139
2013 75 $196,500 135
2012 67 $192,500 143
2011 54 $204,250 139
2010 47 $213,900 119
2009 41 $235,000 160

Sales for Missoula County provide a more regional picture. However, a county representation is not a reliable indicator of the market in any of the individual and unique communities within the county.
Jan Green Graph


 Number of Active Listings: Feb 5, 2014

   Residential  *Condos  Town-  homes Multi-Family  Land   Commercial 
 Missoula Urban Area 345    81       21 24 305 114
MissoulaCounty 564    83       22 29 664 143
Central / North Ravalli County 224     5        3   5 200 58
Mineral & Sanders Counties 203   n/a        n/a  9 419 50
Granite, Powell & Deerlodge Counties 107   n/a        n/a   3 219 20
 

Uncategorized February 14, 2014

Return on Investment and Real Estate